
Page 127 - kpi18886
P. 127
119
paid by investors moving into a zone, as well as the fees paid for
collective services like food service and dormitories. His only obligations
are to supply water and electricity and provide a dry container port at a
convenient distance from the zone. Once a zone is equipped with these
basic necessities, investors may benefit from significant tax incentives.
This explains why the council that oversees the zones created fourteen
zones (although, in reality, only five actually are functional (because
“developers” have not yet been found for the nine remaining zones).
The zones are located near large labor pools like Phnom Penh or near
major transportation axes—either maritime (for the Sihanoukville zones
on the Cambodian Sea, or the Bavet zones on the Vietnamese border),
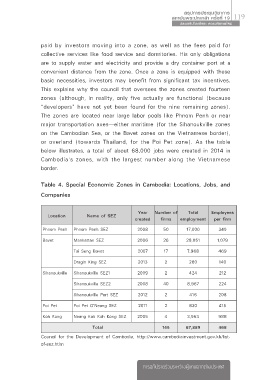
or overland (towards Thailand, for the Poi Pet zone). As the table
below illustrates, a total of about 68,000 jobs were created in 2014 in
Cambodia’s zones, with the largest number along the Vietnamese
border.
Table 4. Special Economic Zones in Cambodia: Locations, Jobs, and
Companies
Year Number of Total Employees
Location Name of SEZ
created firms employment per firm
Phnom Penh Phnom Penh SEZ 2008 50 17,000 340
Bavet Manhattan SEZ 2006 26 28,051 1,079
Tai Seng Bavet 2007 17 7,968 469
Dragin King SEZ 2013 2 280 140
Sihanoukville Sihanoukville SEZ1 2009 2 424 212
Sihanoukville SEZ2 2008 40 8,967 224
Sihanoukville Port SEZ 2012 2 416 208
Poi Pet Poi Pet O’Neang SEZ 2011 2 830 415
Koh Kong Neang Kok Koh Kong SEZ 2005 4 3,953 988
Total 145 67,889 468
Council for the Development of Cambodia, http://www.cambodiainvestment.gov.kh/list-
of-sez.htlm
การอภิปรายรวมระหวางผูแทนจากตางประเทศ