
Page 66 - kpi20756
P. 66
การประชุมวิชาการ
สถาบันพระปกเกล้า ครั้งที่ 21
ลดช่องว่างความเหลื่อมล้ำ สร้างคุณภาพประชาธิปไตย
effects on inclusive citizenship and checks and balances as well as dictatorship.
In countries with low income inequality, the wealthy were no different from the
poor in support for institutions of democracy and opposition to authoritarian rule.
Notice that our cases of lower income equality are all high-income countries,
suggesting the influence of economic growth with declining income disparity, as
captured by the Kuznets curve. Of the socio-demographic characteristics, age
had positive effects on democracy in general and checks and balances while it
had negative effects on dictatorship. As expected, gender had positive effects
only on inclusive citizenship. More notable is that education had positive effects
not only on democracy in general but also on inclusive citizenship and checks
and balances while it had negative effects on dictatorship. In countries with low
income inequality where distributional conflicts are less salient, values and
beliefs, as captured especially by education, seem to play a larger role in
shaping attitudes towards political regime.
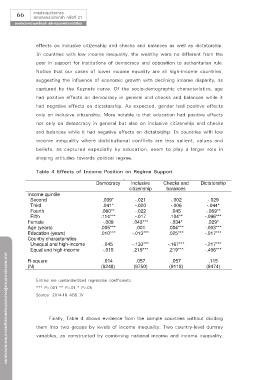
Table 4 Effects of Income Position on Regime Support
Table 4 Effects of Income Position on Regime Support
Democracy Inclusive Checks and Dictatorship
citizenship balances
Income quintile
Second .039* -.021 -.002 -.029
Third .041* -.020 -.006 -.044*
Fourth .060** -.022 .045 -.069**
Fifth .114*** -.017 .104** -.096***
Female -.009 .043*** -.034* .029*
Age (years) .005*** .001 .004*** -.003***
Education (years) .010*** -.013*** .025*** -.017***
Country characteristics
Unequal and high-income .045 -.133*** -.167*** -.217***
Equal and high-income -.015 .219*** .219*** -.406***
เอกสารประกอบการอภิปรายร่วมระหว่างผู้แทนจากต่างประเทศ
R-square .014 .057 .057 .115
(N) (9248) (9750) (9118) (9474)
Entries are unstandardized regression coefficients.
*** P<.001 ** P<.01 * P<.05
Entries are unstandardized regression coefficients.
Source: 2014-16 ABS IV
*** P<.001 ** P<.01 * P<.05
Source: 2014-16 ABS IV
Finally, Table 4 shows evidence from the sample countries without dividing
them into two groups by levels of income inequality. Two country-level dummy
variables, as constructed by combining national income and income inequality,
18